
I was born and grown in Anqing, Anhui Province, China (安徽省安庆市). Now, I am a master student in the Chang’an University (CHU), supervised by Prof. Ling Han. I received the bachelor’s Degree (2018-2022) from the School of Land Engineering, Chang’an University,China.
My research interest includes:
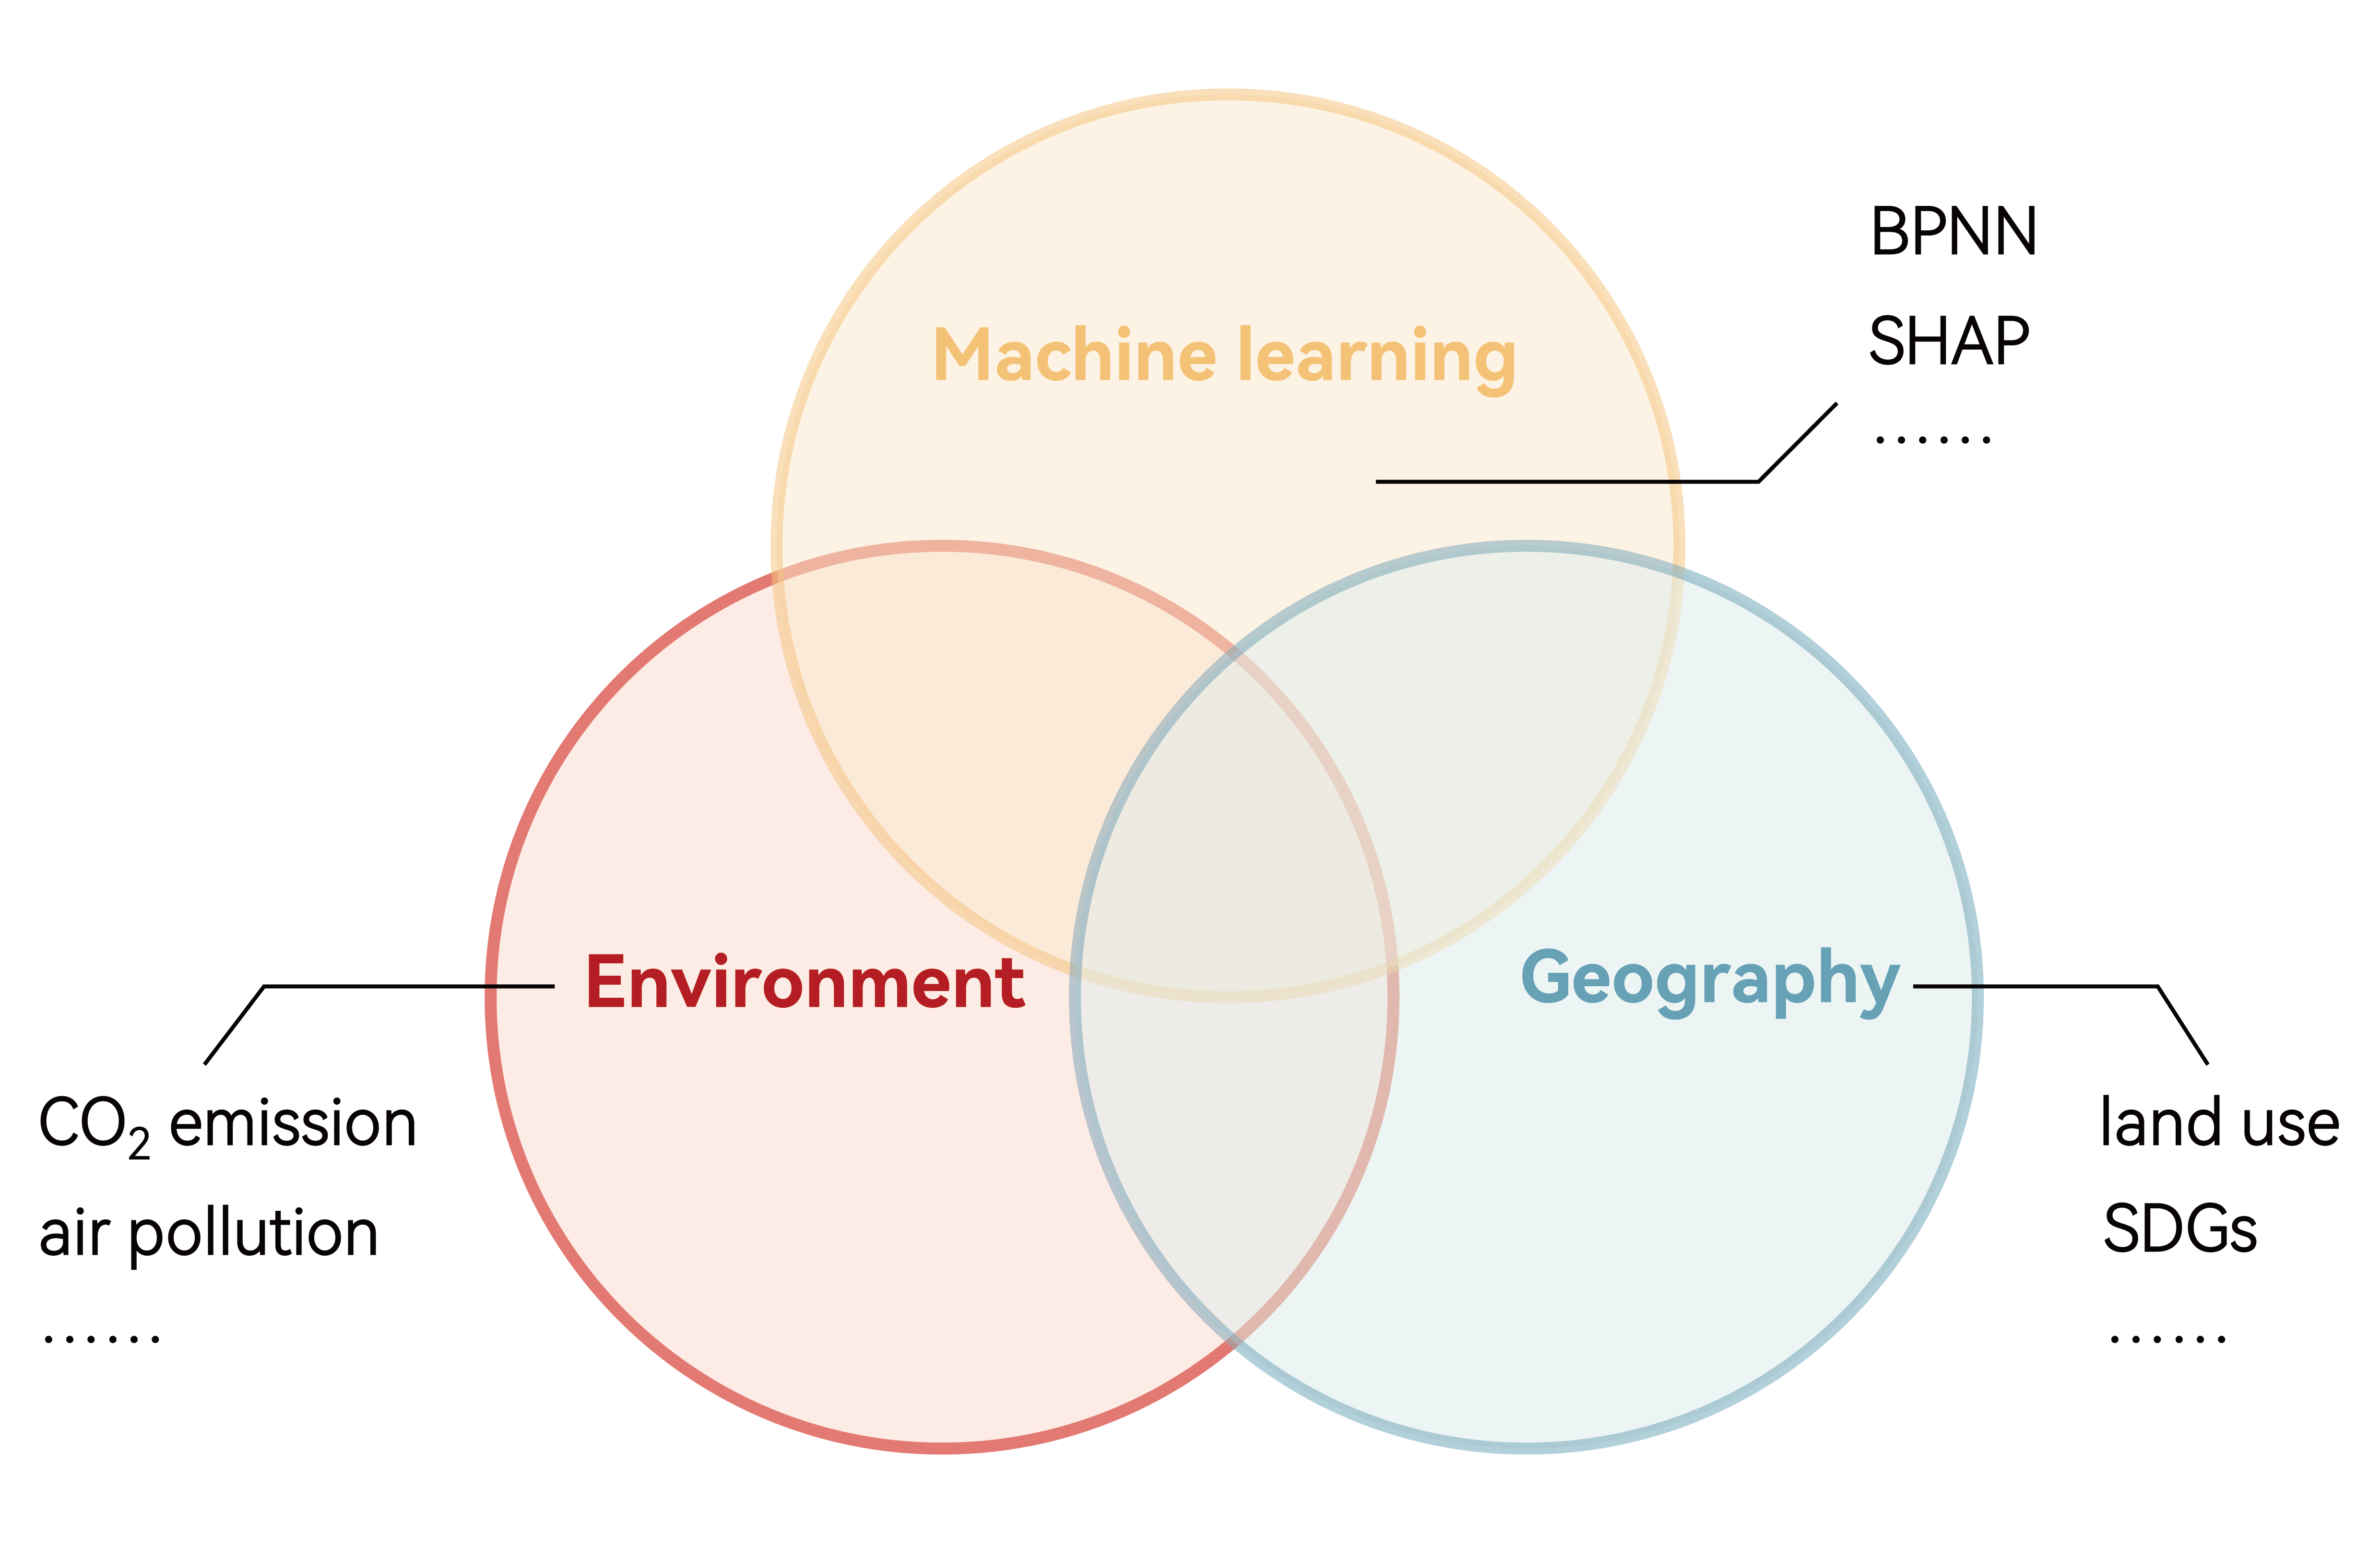
Currently, my research interests focus on the interplay among Environment, Geography and Machine learning, which can be described as:
- Multidisciplinary Research at the Nexus of Environment, Geography, and Machine Learning. My research lies at the intersection of environmental science, geographical analysis, and machine learning. I employ advanced machine learning techniques such as BPNN and SHAP to improve the predictive accuracy and understanding of environmental phenomena, particularly focusing on CO₂ emissions and air pollution.
- Geographical Analysis for Sustainable Environmental Management. My future work will involve leveraging geographical data to analyze land use patterns and their implications for Sustainable Development Goals (SDGs). This geographic-environmental integration helps in crafting strategies for sustainable land management and addressing key environmental challenges.
- Machine Learning in Environmental Impact Assessment. I explore the application of machine learning in evaluating environmental impacts, with a particular emphasis on CO₂ emissions. By combining these approaches, I aim to provide data-driven insights that inform and enhance sustainability efforts on both regional and global scales.
My skills include:
📖 Educations
- M.S. 2022.09-2025.06 (now), Chang’an University, Xi’an, Land Resource Management;
- B.S. 2018.09-2022.06, Chang’an University, Xi’an, Land Resource Management;
📝 Selected Publications
Environmental Pollution
Ziyan Liu, Ling Han*, Ming Liu
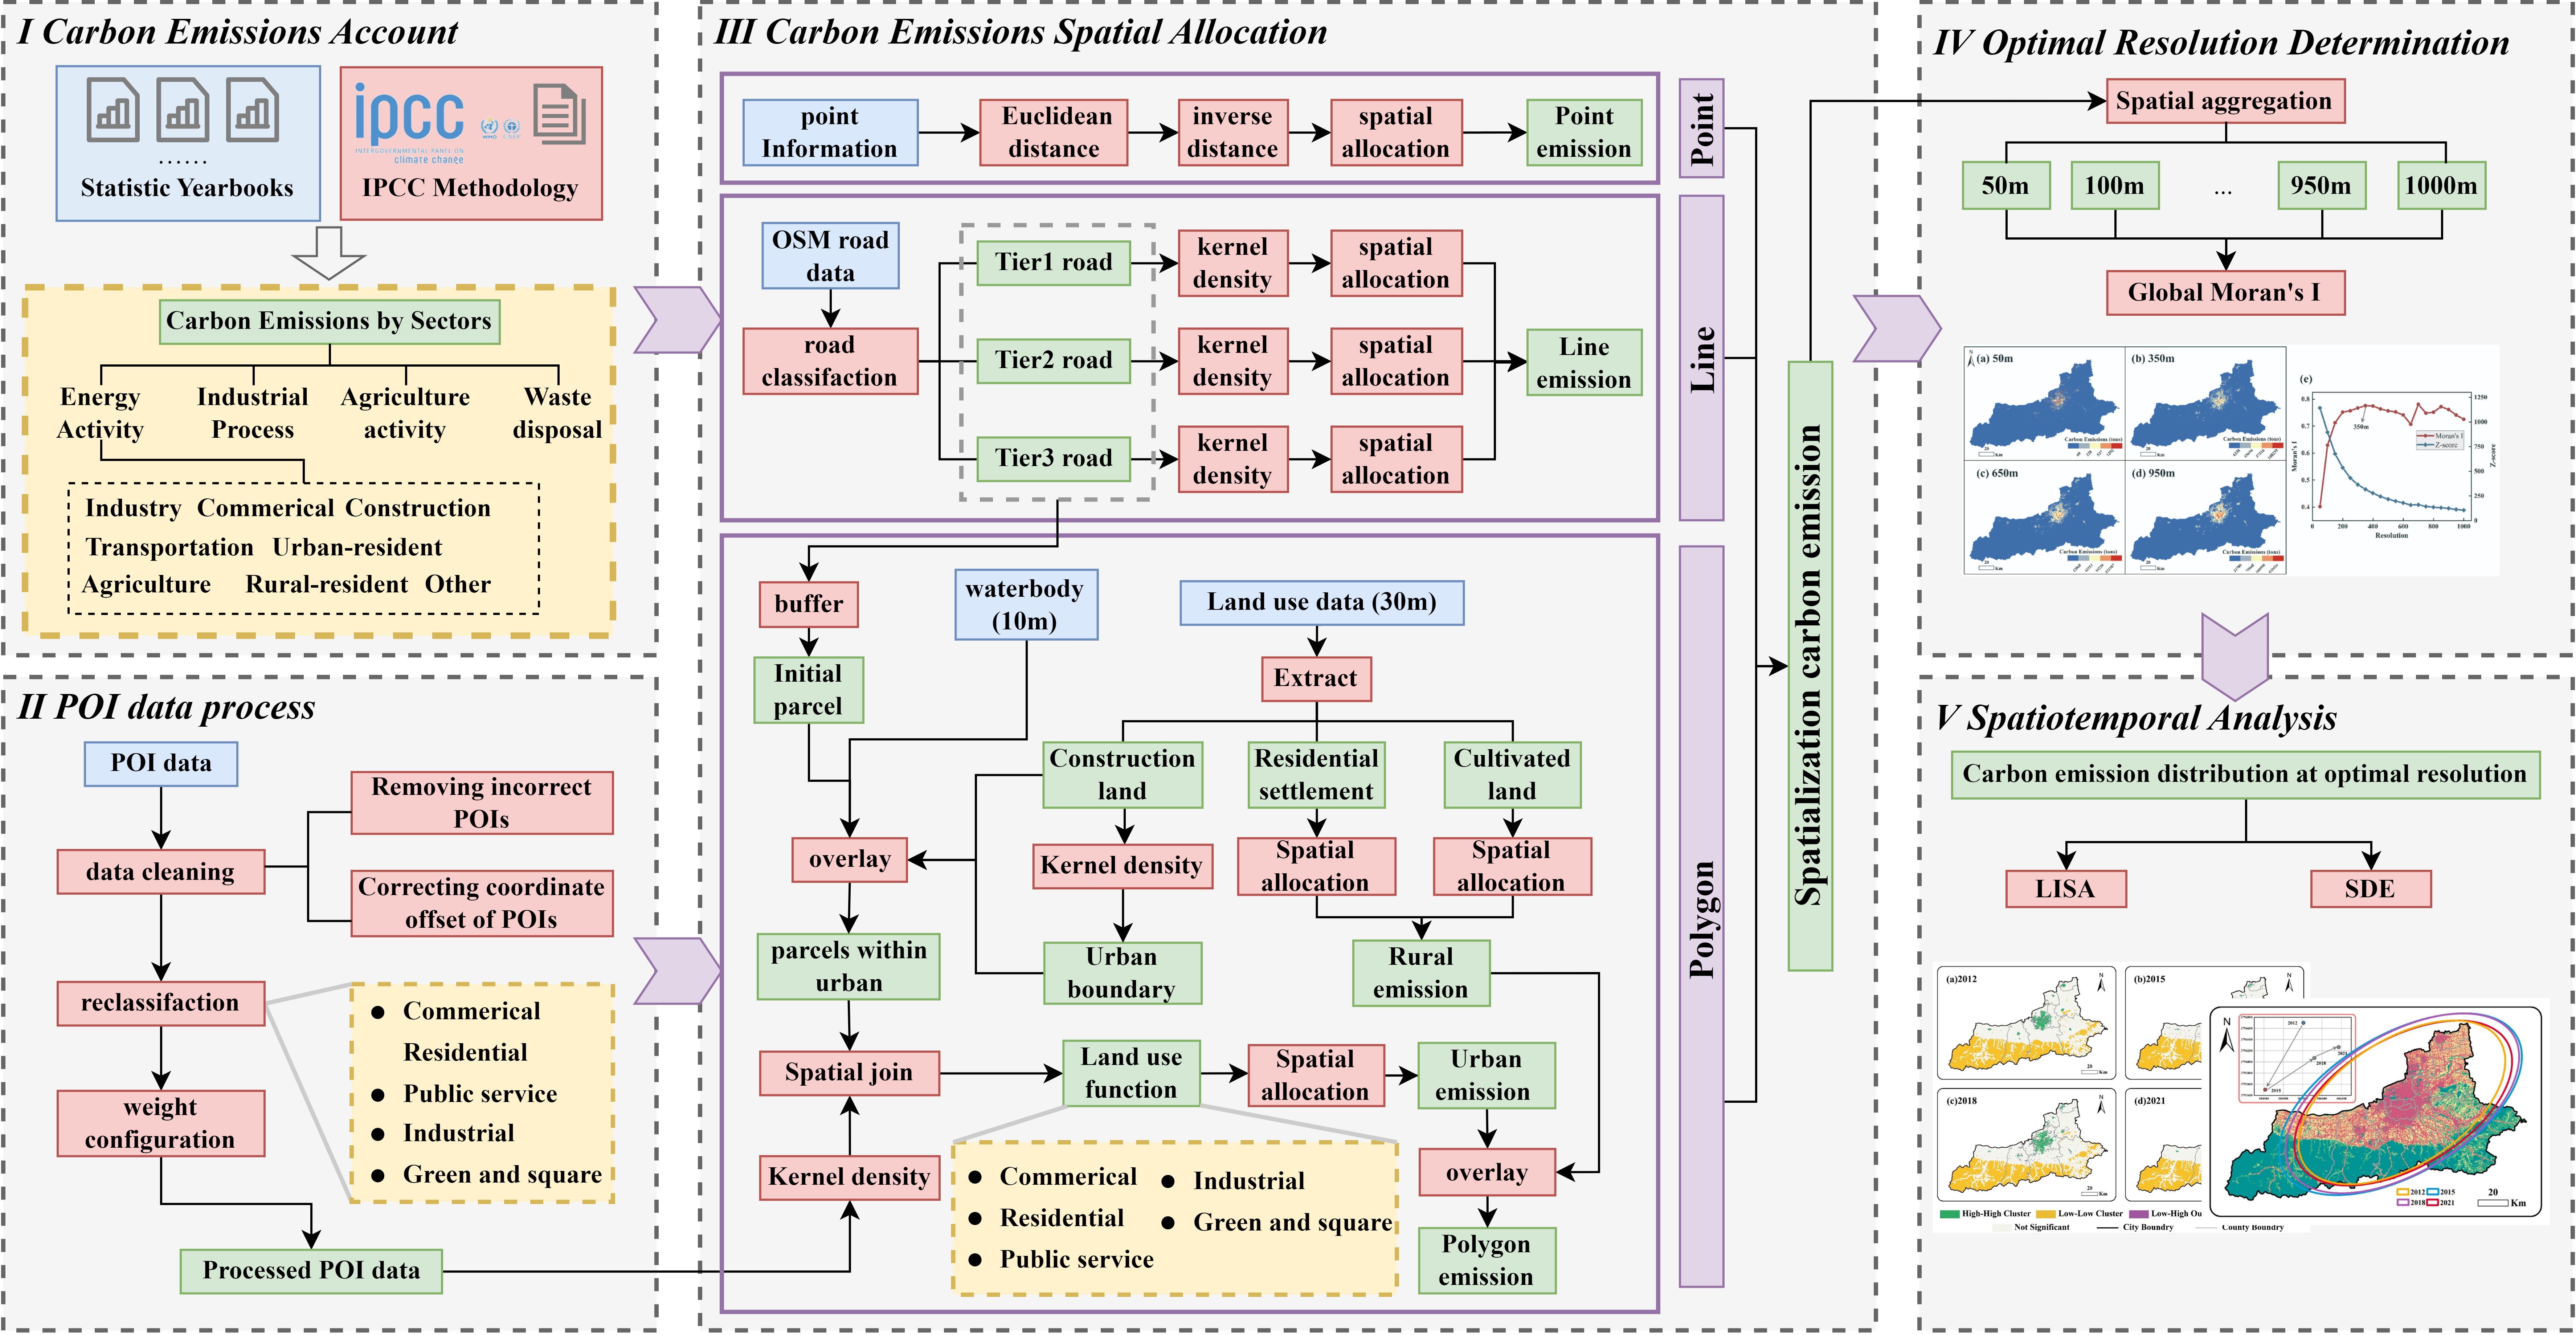
Cities, contributing over 70% of global emissions, are key areas for climate change mitigation. Heterogeneity within cities determines the need for spatialized urban emissions reduction policies. However, few studies have attempted to characterize the spatial distribution of carbon emissions at the urban scale. To address this issue, a novel mapping method was proposed, using Xi’an as an example to explore the spatial distribution of carbon emissions at the city scale. Firstly, multiple geospatial open-source data, such as point of interest (POI), road networks, and land use, were utilized to identify the locations of emission sources. High-resolution carbon emission distributions were then mapped by allocating emissions based on the Intergovernmental Panel on Climate Change (IPCC) methodology. The study employed Global Moran’s I to analyze the changes in spatial heterogeneity at different resolutions. Additionally, the Local Indicators of Spatial Association index (LISA) and Standard Deviation Ellipses (SDE) were adopted to examine the spatiotemporal characteristics of carbon emissions in Xi’an. The results show that carbon emissions at Xi’an City rises from 45.112 million tons to 72.701 million tons between 2010-2021. The construction of multi-scale carbon emissions spatial distributions, with a resolution of up to 30m, allowed for a more detailed characterization of carbon emissions, especially in urban fringe areas. In addition, the results indicate that that urban carbon emissions exhibit the strongest spatial autocorrelation at a resolution of 350m. The study can provide a reference for the development of regional carbon emission reduction policies and spatial planning. In addition, the proposed spatialized method of city carbon emissions depends on open-source data, which allows it to have the potential for application in other cities.
Environmental Science and Pollution Research
Ziyan Liu, Ling Han*, Ming Liu
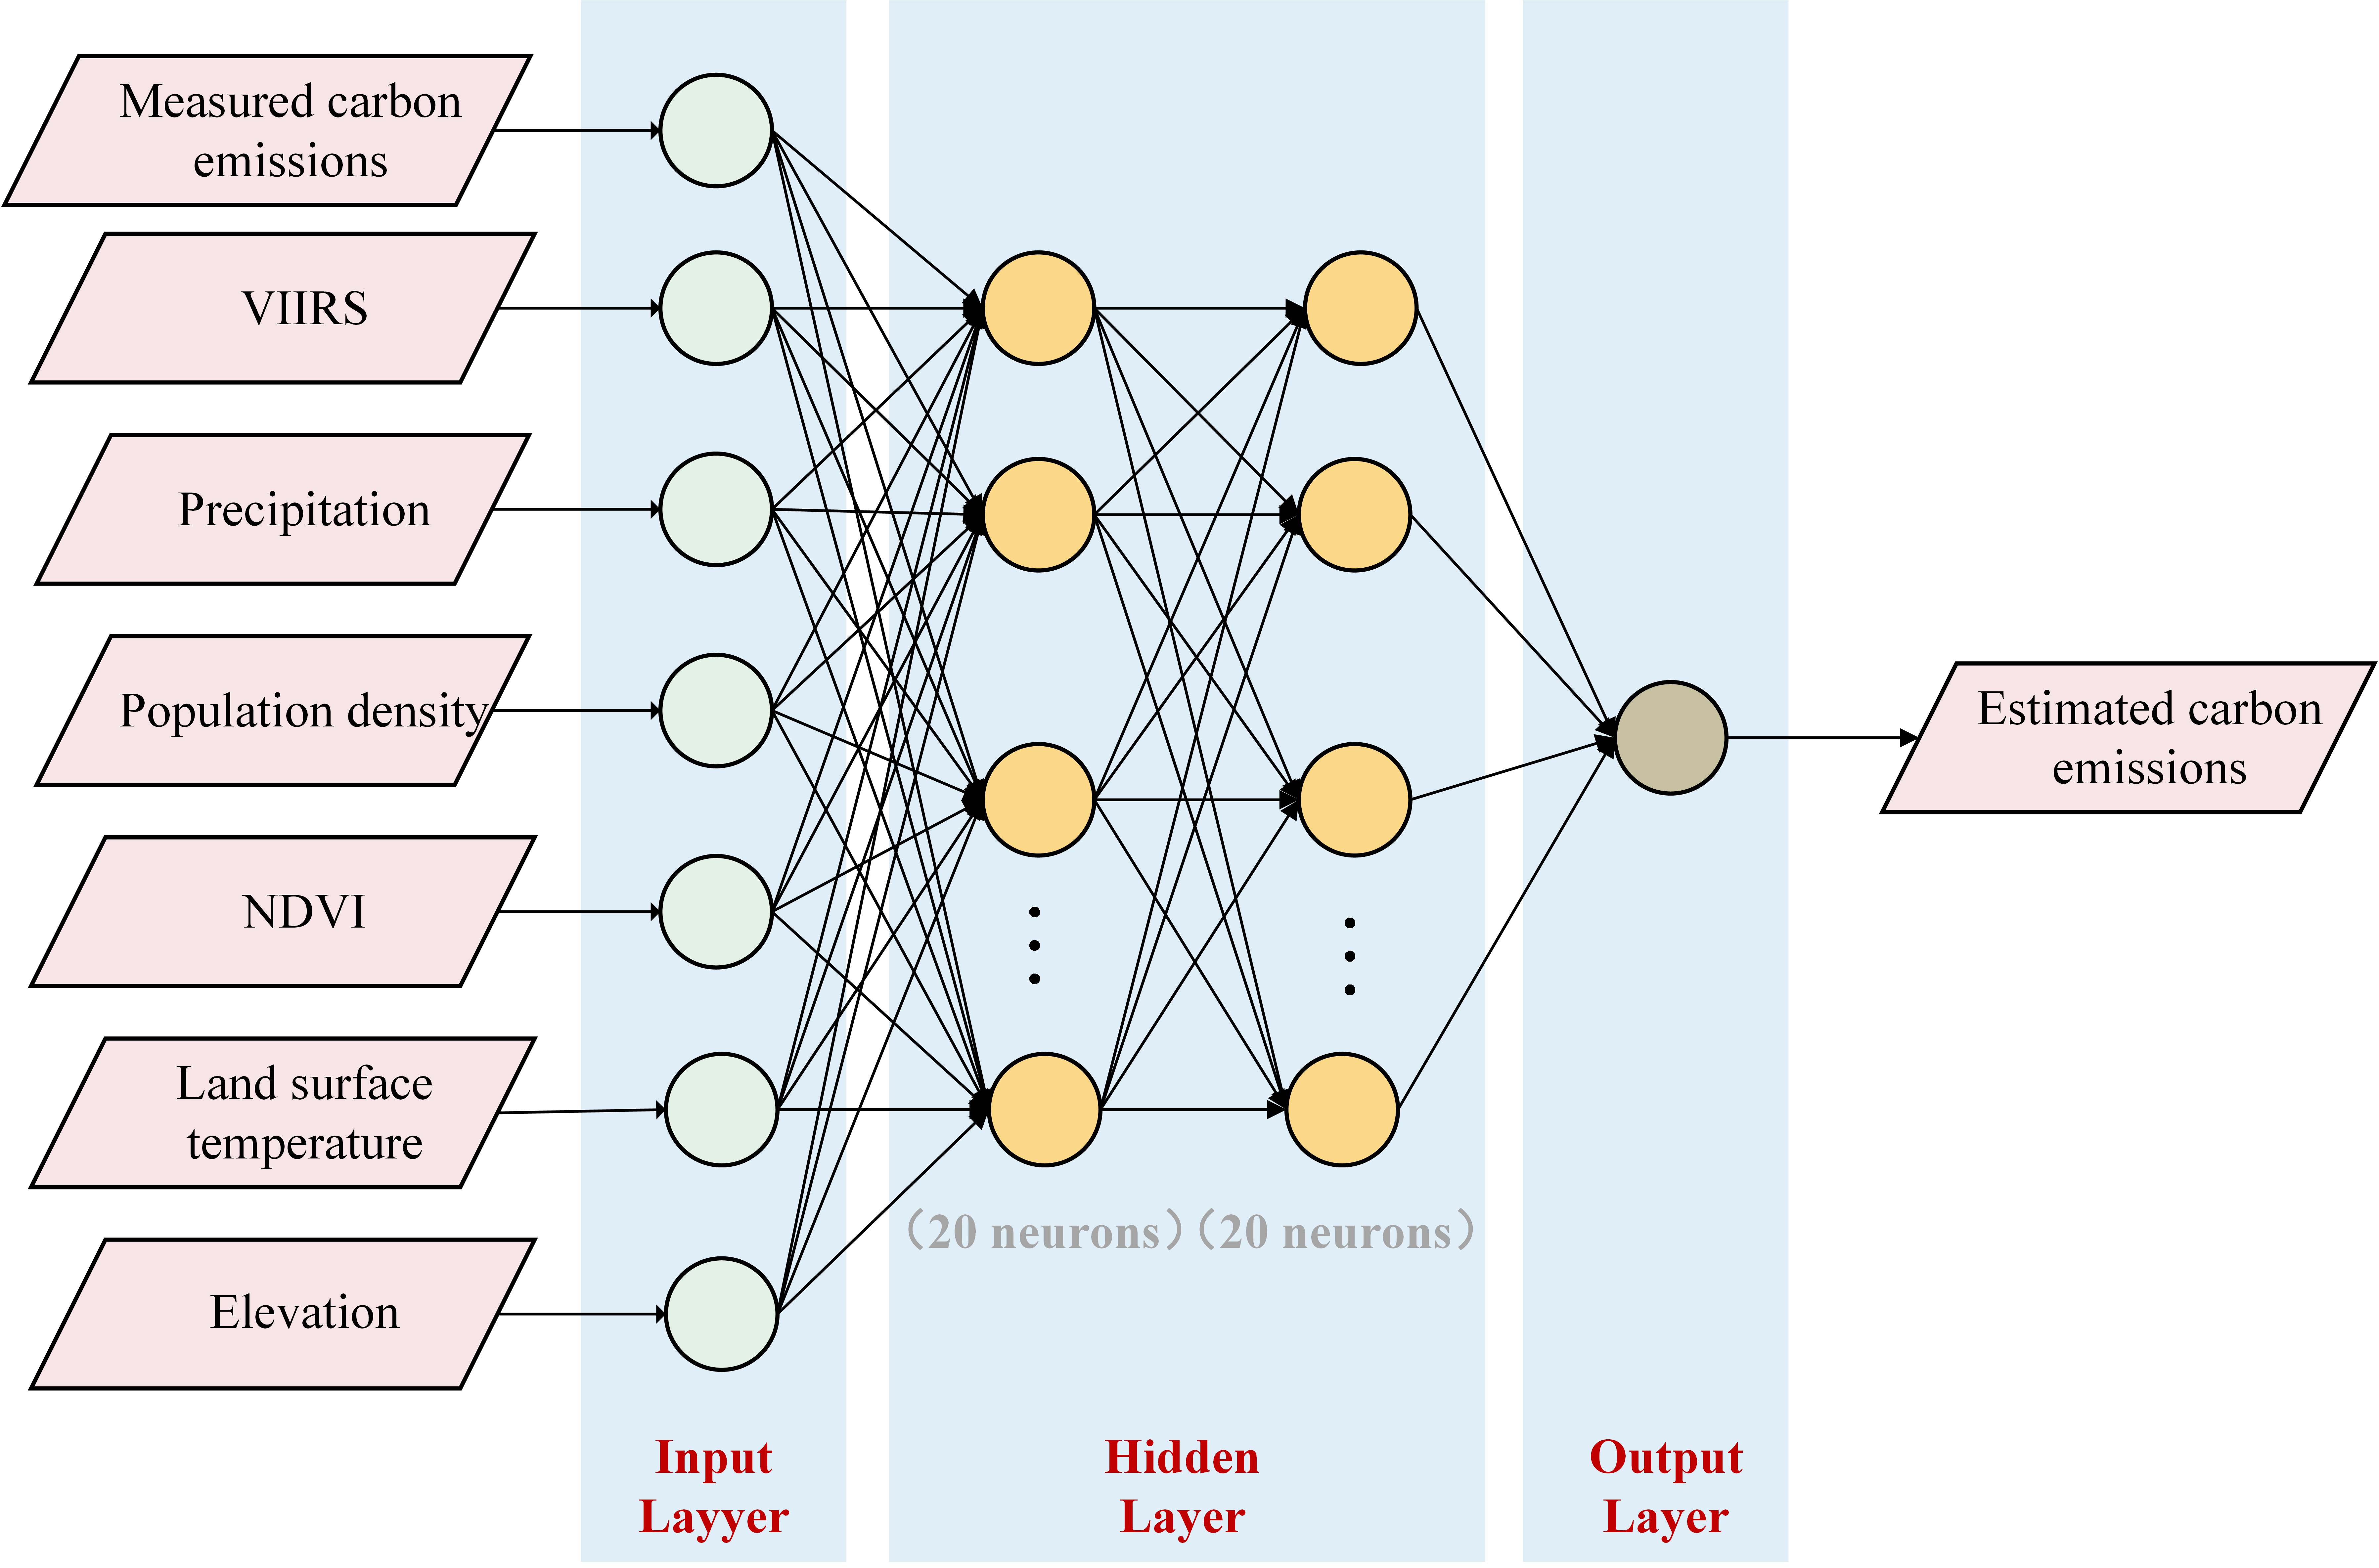
Global warming attributed to the emission of greenhouse gases has caused unprecedented extreme weather events, such as excessive heatwave and rainfall, posing enormous threats to human life and sustainable development. China, as the toppest CO2 emitter in the world, has promised to achieve carbon emission peak by 2030. However, it is difficult to estimate county-level carbon emissions in China because of the lack of statistical data. Previous studies have established relationship between carbon emission and nighttime light; however, using only nighttime light for carbon emission modeling ignores the impact of natural or other socioeconomic factors on emissions. In this paper, we adopted the back propagation neural network to estimate carbon emissions at county level in Shaanxi, China, using nighttime light, Normalized Difference Vegetation Index, precipitation, land surface temperature, elevation, and population density. Trend analysis, spatial autocorrelation, and standard deviation ellipse were employed to analyze the spatiotemporal distributions of carbon emission during 2012–2019. Three metrics (R², root mean square error, and mean absolute error) were adopted to validate the accuracy of the proposed model, with the values of 0.95, 1.30, and 0.58 million tons, respectively, demonstrating a comparable estimation performance. The results present that carbon emissions in Shaanxi Province rise from 256.73 in 2012 to 305.87 million tons in 2019, formatting two hotspots in Xi’an and Yulin city. The proposed model can estimate carbon emissions of Shaanxi Province at a finer scale with an acceptable accuracy, which can be efficiently applied in other spatial or temporal domains after being localized, providing technical supports for carbon reduction.
Ming Liu*, Ziyan Liu*, Gaoxiang Zhou, Ying Wang, Xuancheng Liu, Ling Han
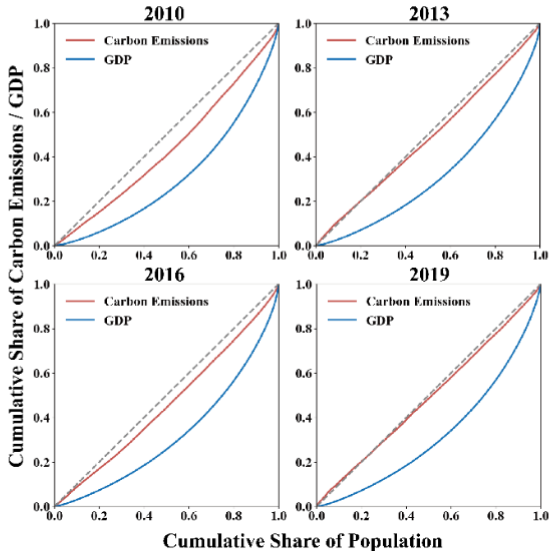
High carbon emissions (CE) have unbalanced the carbon cycle patterns on Earth, resulting in global warming and extreme weather events. However, the disparity and inequalities of carbon emissions have barely been explored from environmental justice perspective, which can help to formulate a more equitable carbon policy. Therefore, the satellite-based ODIAC dataset was adopted to first analyze the spatiotemporal characteristics of CE in China between 2010 and 2019; then the spatial disparities and environmental inequalities of CE were explored during the study period. The results show that CE in China increased by 13.74% during 2010-2019, with decadal mean of 91.49 million tons. The hotspots were observed in the eastern coastal and the northeastern regions. The spatial disparity decreased over the decade, with Theil index declining from 0.186 in 2010 to 0.163 in 2019. The inequality result indicates CE disproportionately affected populations living in low GDP per capita regions, while it became more equally distributed over time. The results suggest that the spatial and environmental inequality of CE need to be considered in policy formulation for a more equitable environment.
Changes of spatial disparities in satellite-derived pm2.5 exposures over 2010–2019 in china
Ming Liu*, Gaoxiang Zhou, Ziyan Liu, Ling Han, Jonathan Li
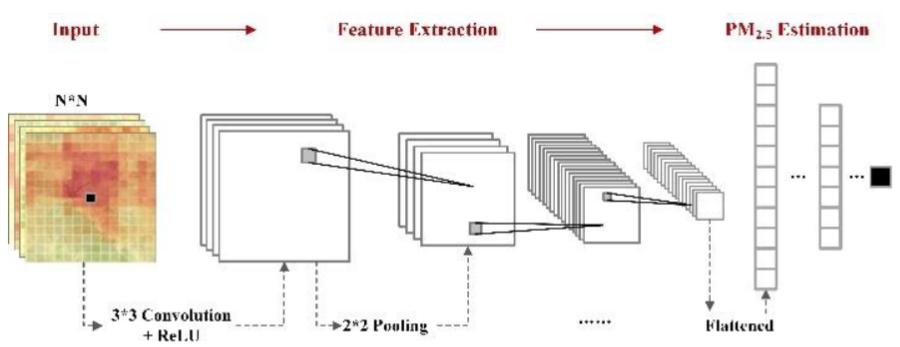
Air pollution, especially fine particulate matter (PM2.5), has attracted extensive attention due to its adverse impacts on public health. Although PM2.5 pollution was significantly reduced in China over time, while little is known how the spatial disparity of PM2.5 exposure has evolved, especially from both absolute and relative perspectives. Here, we estimate the long-term PM2.5 exposures in China based on satellite observations and convolutional neural network, and characterize the spatial disparity of PM2.5 exposure using Theil index and rank-rank relationship. The result shows that both PM2.5 exposure and absolute spatial disparity were substantially reduced between 2010 and 2019. The nation-wide concentrations (Theil index) declined from 48.0μg/m3 (0.13) to 35.5μg/m3 (0.054). The interprovincial disparities dominate the overall disparity in 2010, while the intra-provincial disparity contributed the most in 2019. However, while absolute disparities have diminished, relative disparities persist. PM2.5 exposures in the least 20th percentile polluted cities have increased over time, while exposures in other regions declined. On average, the more (less) polluted cities in 2010 were still the more (less) polluted cities in 2019 (except for the very most 2 percentile polluted cities), indicating that the population in more polluted cities still experiences more air pollution than others. Spatial pattern of relative disparity changes was also observed. Overall, understanding not only absolute spatial disparity but also relative disparity is required to help formulate targeted policies for an equitable environment, leaving nobody behind.
🎖 Honors and Awards
- 2023.10 National Scholarship for Graduated Students.
- 2022.10 The First Prize Scholarship of CHU.
🪐 Competitions
- 2022.12 The Third Prize: China Graduate Students “Carbon Peaking & Carbon Neutrality” Innovation and Creativity Competition (CLEER) (Rank:1/5)
- 2023.12 The Third Prize: China Graduate Students “Carbon Peaking & Carbon Neutrality” Innovation and Creativity Competition (CLEER) (Rank:2/5)
- 2023.11 The Second Prize: ESRI Cup China University Students GIS Software Development Competition. (Rank:2/4)